Bid vs. Ask: Decoding the Market's Conversation for Smarter Trading
This blog post will cover:
- Decoding Bid and Ask Prices: The Language of the Market's Dance
- The Bid-Ask Spread: A Closer Look at the Gap
- Factors Influencing the Spread: Market Dynamics at Play
- The Spread's Impact on Trading Strategies: A Hidden Cost
- Strategies for Minimizing the Spread's Impact: Trade Smarter, Not Harder
- Tools for Analyzing the Bid-Ask Spread: Data-Driven Decisions
- Advanced Concepts: Market Makers and Order Books Revisited
- Conclusion: Master the Spread, Master Your Profits
Starting out in trading can feel a bit overwhelming—there’s a lot of new language to get used to, and even the simplest terms can carry more weight than they seem. Take “bid” and “ask,” for example. These numbers are everywhere, but they’re more than just figures on a screen—they’re a snapshot of what buyers are willing to pay, what sellers are asking for, and the ongoing tug-of-war that sets prices in motion. That small gap between them, known as the spread, can say a lot about how active a market is or how confident people are about an asset’s value. Understanding how this works is less about memorizing definitions and more about seeing how trades really happen—and that kind of insight can go a long way when you're navigating the market.
Decoding Bid and Ask Prices: The Language of the Market's Dance
So, before we start throwing out examples, it's probably a good idea to just pause and really grasp what "bid" and "ask" actually represent, and how they kind of work off each other. Look, this isn't just about memorizing some dry definitions. Think of the market more like a non-stop chat. On one end, you've got folks who want to buy stuff, and on the other, you've got folks looking to sell. The bid and the ask are literally just the prices they're putting forward at any given moment. They're stating their terms: "Here's my offer to buy," or "Here's the price I'm asking to sell." This dynamic interplay, this back and forth, is happening constantly, shaping the price of everything being traded. It's really the core engine driving the market.
What is the Bid Price?
So what exactly is the bid price? Let's try and think about it this way – imagine you've got something you want to sell. Maybe it's that old laptop you're not using anymore, just sitting there. The "bid price," in the financial world, is basically the most someone is willing to offer you for it right now. You see this everywhere in trading. It's the top price a buyer is prepared to pay for whatever asset you're looking at – could be a share of stock, a little bit of Bitcoin, or even just swapping dollars for euros. It's your first peek into what people are actually willing to pay, you know? It tells you something about the current demand. Generally, if that bid price is sitting pretty high, it's usually a good sign there's a fair bit of interest, that folks are really looking to buy that thing. And honestly, when you add up what everyone's willing to bid, that whole collective effort is a huge piece of the puzzle in figuring out what something is actually worth in the market.
What is the Ask Price?
Now, sticking with our hypothetical laptop sale, the "ask price" is the price you, as the seller, are hoping to get for it. It's your asking price, plain and simple. In financial markets, the ask price (sometimes also called the "offer price") is the minimum amount a seller is willing to accept for an asset. It reflects the current market supply. A lower ask price might indicate that there are more sellers out there who are keen to offload the asset. Just like the bids, the combined force of all the "asks" plays a really significant role in the whole price discovery process.
Real-World Examples of Bid and Ask in Action
You'll honestly find bid and ask prices pretty much everywhere you turn in the trading world. They are, without exaggeration, the fundamental building blocks. Consider the stock market, for instance. When you look up a stock quote for any company, you are invariably going to see both a bid price and an ask price listed. Let's use a simple illustration: imagine a company's stock is quoted with a bid of $150.00 and an ask of $150.50. What this specifically communicates to you is that the highest price currently offered by a buyer for that particular stock is $150.00. Conversely, the lowest price a seller is currently willing to accept for that same stock is $150.50. That 50-cent difference you see there? That is precisely the spread, a concept we will definitely explore in much more detail very shortly.
So, you know, it's totally the same deal with cryptocurrency exchanges. Places like Coinbase or Binance, right? They're constantly showing you the buy and sell prices – the bid and ask – for just about every pair they let you trade. You might look at Bitcoin and see, okay, the bid price is something like $60,000, and then the ask is maybe $60,050. And these numbers? Man, they are moving! They're literally changing every single second. Why? Because people are just non-stop putting in and taking out buy and sell orders. Even in the forex markets, where you're just trading one country's money for another's (like, you know, trading Euros for US Dollars), you'll see these bid and ask rates. They just show you, right then and there, what folks are willing to buy or sell that currency pair for. These prices, which you can usually see super easily on your trading screen or whatever trading view you're using, they're always, always updating. It's just that constant back and forth, that push and pull between buyers and sellers.
The Bid-Ask Spread: A Closer Look at the Gap
Let’s take a closer look at that space between the bid and the ask—the small gap that shows up on every trading screen. It might seem minor, but it’s actually a key detail. That gap is called the bid-ask spread, and it’s more than just a technicality—it’s part of the real cost of trading. At the same time, it can tell you a lot. For one, it gives you a sense of how liquid an asset is—how easily you can buy or sell without causing much of a price shift. It can also offer a quick read on the market’s mood. A tight spread usually means things are calm and active. A wider one? That might be a sign of hesitation, uncertainty, or low participation.
Calculating the Bid-Ask Spread: A Simple Formula
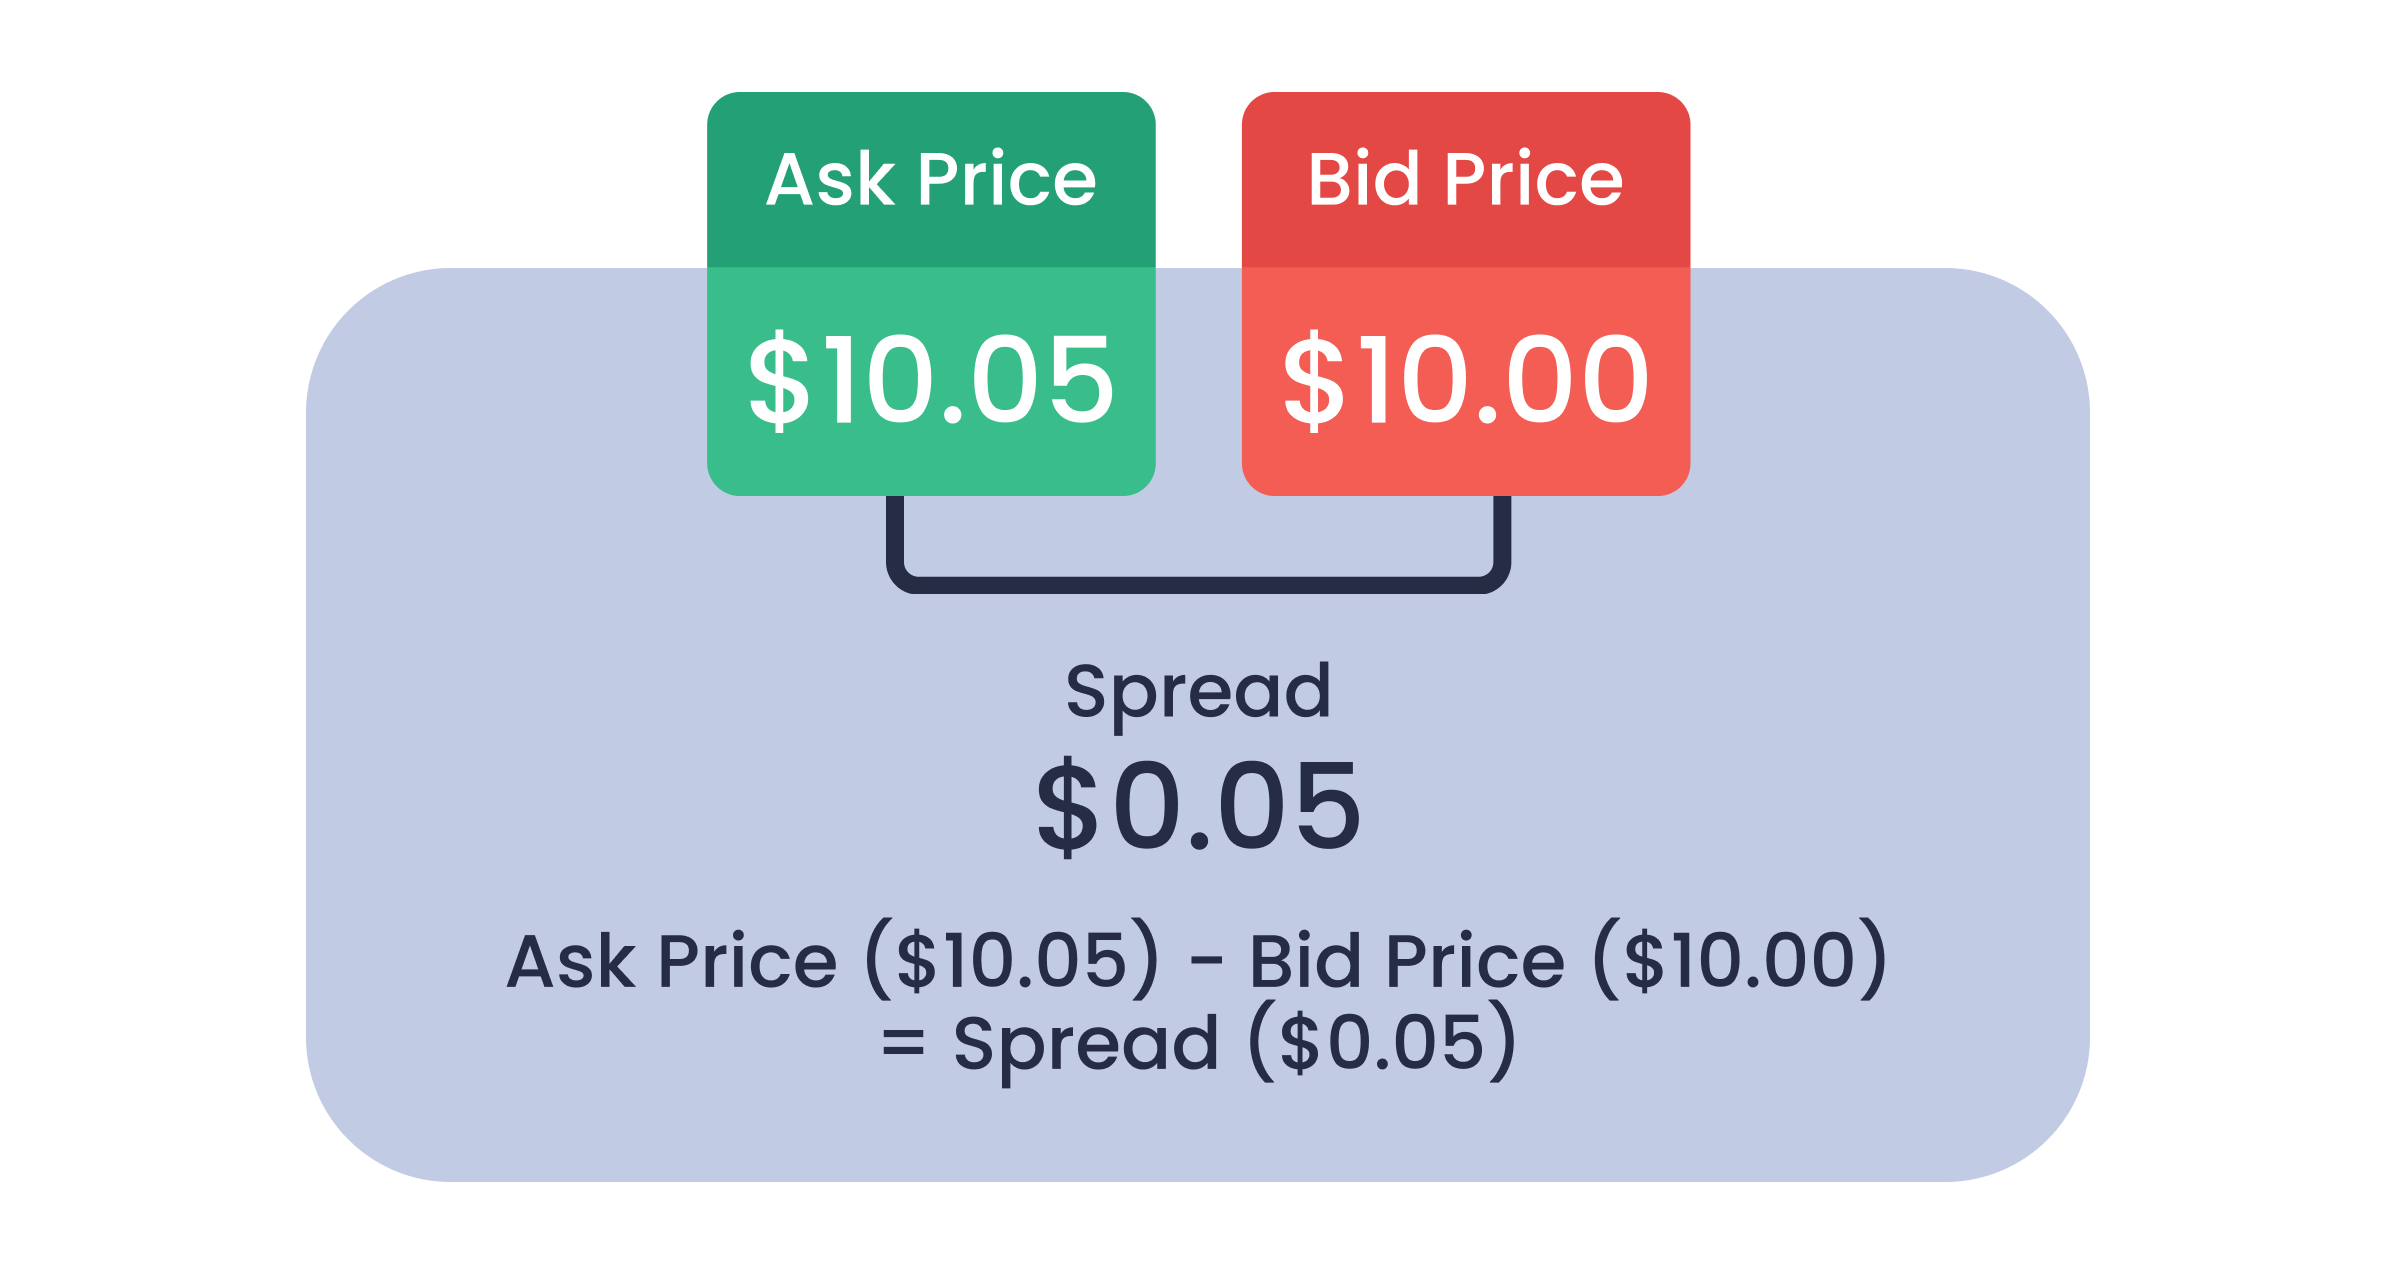
Figuring out the bid-ask spread is super straightforward. You just subtract the bid price from the ask price. The formula looks like this:
Ask Price - Bid Price = Spread
So, if we go back to our stock example with an ask price of $10.05 and a bid price of $10.00, the spread is $0.05. Simple enough, right?
Why Does the Bid-Ask Spread Exist?
Now, regarding the existence of that gap – the difference between what buyers are willing to pay and what sellers are willing to accept – the primary reason lies with market makers. These individuals or, more commonly, institutions, serve as essential facilitators within the market. They are typically significant financial institutions or specialized trading firms whose fundamental role is to maintain a constant readiness to buy assets (at the bid price) and sell assets (at the ask price). In doing so, they are providing liquidity. This means they ensure that whenever you, as a market participant, wish to buy an asset, there is a readily available counterparty to sell to you, and conversely, when you wish to sell, there is a party prepared to buy from you. They are, in essence, continuously active and available to trade in the market.
Understanding a market maker's role is clearer if you consider a retailer. A store purchases items wholesale and then sells them at a slightly higher retail price, with the difference forming their income. Market makers operate on this principle: they acquire assets at the bid price and sell at the ask. The resulting bid-ask spread serves as their compensation. This compensates them both for facilitating transactions and for the inherent risk involved. They hold an inventory of assets, and face the risk that prices could fall before they sell. Thus, the spread is how they are compensated for their service and risk.
What a Narrow vs. Wide Spread Tells You
The bid-ask spread's size actually tells you quite a bit about what's happening in the market. Generally speaking, a narrow spread points to high liquidity. What that means is you've got a lot of people actively buying and selling the asset. That competition naturally tightens the gap between what buyers will pay and what sellers will take. Assets with massive trading volumes, things like major currencies or the biggest stocks – the ones in the S&P 500, you know? – they typically have much smaller spreads. If you look at cryptocurrency data on sites like CoinMarketCap, you'll notice the more established coins usually show tighter spreads. It also makes sense that assets with narrow spreads tend to be less volatile; high activity often smooths out price fluctuations.
When the gap between the bid and ask prices starts to widen, it’s often a sign that the market is running low on liquidity. In simple terms, there just aren’t enough buyers and sellers actively trading. This kind of environment tends to show up during periods of uncertainty—when no one’s quite sure what an asset is really worth or where it’s headed next. A wide spread can reflect hesitation, almost like the market is pausing to figure things out. During these moments, prices can swing more sharply, sometimes without much warning. For anyone watching the markets closely, the size of the spread can offer a subtle clue about what’s going on beneath the surface. It doesn’t give answers, but it does raise the right questions.
Factors Influencing the Spread: Market Dynamics at Play
The bid-ask spread isn’t fixed—it moves around as the market reacts to whatever’s happening at the moment. It can tighten when things are calm and liquid, or widen when uncertainty kicks in. A handful of different forces are constantly pushing and pulling on it, and knowing what those are can give you a better read on what the market’s trying to tell you beneath the surface.
Liquidity: The Lifeblood of a Narrow Spread
Liquidity plays a major role in determining the size of the spread. In simple terms, it refers to how easily an asset can be bought or sold without causing a major shift in its price. When there’s high trading volume and plenty of market participants, liquidity tends to be stronger. This results in a deeper order book, filled with a broader range of buy and sell offers across different price levels.
Assets that are heavily traded—like major cryptocurrencies or popular stocks—often show narrower spreads during peak trading hours. This tends to happen when multiple global exchanges are open at the same time, increasing both trading activity and the number of market makers competing for trades. That competition leads to tighter spreads as participants adjust prices more aggressively to attract orders. More buyers and sellers in the mix generally means more efficient pricing.
Volatility: A Wider Spread's Best Friend
When markets get shaky and prices start jumping around, the bid-ask spread usually doesn’t stay quiet. Volatility—those sudden, unpredictable price moves—makes it harder for anyone setting prices to know where things are headed. For market makers, that uncertainty means more risk. To give themselves a bit of breathing room, they’ll often widen the spread, creating a buffer against fast-moving shifts that could catch them off guard.
You’ll often see this happen around big news moments—things like inflation data, central bank announcements, or unexpected geopolitical events. These developments can jolt the market, sometimes within seconds. And when the outlook gets blurry, spreads tend to stretch. It’s the market’s way of saying, “Let’s wait and see,” while pricing in the extra risk hanging in the air.
Asset Type: Stocks vs. Crypto vs. Forex
The size of the bid-ask spread can change a lot depending on what you're trading. Stocks, crypto, and forex all have their own quirks—and those differences show up in how prices are set.
Take large-cap stocks, for example—the kind you’d find in the S&P 500. These usually trade with really tight spreads. There’s a ton of activity, and plenty of people buying and selling at any given moment, which keeps pricing efficient. In the forex market, it’s a similar story. Major currency pairs like EUR/USD have some of the smallest spreads out there, mostly because they’re traded around the clock and by a massive number of participants worldwide.
Crypto, though, can be a different experience. Big names like Bitcoin and Ethereum often have decent liquidity on popular exchanges, especially when markets are busy. But once you get into smaller or less-traded coins, spreads can get noticeably wider. There’s more volatility, fewer buyers and sellers, and in some cases, fragmented pricing across platforms. It’s not uncommon for newer tokens or low-volume pairs to have spreads that are all over the place. That’s why checking the spread before placing a trade isn’t just a good habit—it can save you from unexpected costs.
The Spread's Impact on Trading Strategies: A Hidden Cost
The bid-ask spread, while sometimes overlooked, is a very real cost of trading. It can significantly impact how effective different trading strategies are. This "hidden cost" is particularly important for traders who are making lots of trades or who are operating with really tight profit margins on each trade. Let's look at how the spread affects different trading styles.
Day Trading: Every Pip Counts
For day traders and scalpers, where the goal is to profit from tiny price movements throughout the day, the bid-ask spread plays a huge role. These traders aren’t aiming for big swings—they’re looking to grab small gains, sometimes just a few cents or a fraction of a percent. But here’s the catch: if you’re not factoring in the spread, you’re already starting each trade at a disadvantage. The price has to move just to cover that gap, and with enough trades, those small “built-in” costs can pile up fast.
Say someone’s scalping a coin and hoping to earn 0.1% per trade—if the spread is also 0.1%, then technically they’re already down the moment they enter. Multiply that across dozens or hundreds of trades, and the impact becomes impossible to ignore. This means the price has to move twice as far in their favor just to break even, significantly reducing the probability of a profitable trade. Remember that moment in the intro where you finally realized why you were losing money even when your analysis seemed right? This is often a huge part of it in action for frequent traders.
Swing Trading: A Less Immediate Impact
Swing trading, which involves holding positions for a few days or even a couple of weeks to capture larger price swings, is generally less sensitive to the immediate impact of the bid-ask spread compared to day trading. Because you're targeting bigger moves (larger "pip" movements), the relative importance of a smaller spread becomes less significant in the grand scheme of the trade's potential profit. While the spread is still a cost that you absolutely need to consider, it becomes a smaller percentage of the overall potential gain you're aiming for.
That said, the spread should still be factored into the overall risk and reward of any setup. Even if it’s a small percentage of a larger move, it’s part of the total cost of entering and exiting a trade. What matters most is making sure the expected upside clearly outweighs both the spread and the risk involved—especially in markets with wider spreads or more volatile price action.
Long-Term Investing: A Negligible Factor (Usually)
For long-term investors who use a buy-and-hold strategy, the bid-ask spread is typically a pretty negligible factor. When you're holding assets for months, years, or even decades, the initial cost incurred from the spread when you first buy the asset becomes tiny compared to the potential long-term gains you might see from the asset's value increasing (capital appreciation) and any dividends or distributions you receive. That cost of the spread today will become a much, much less impactful number over the really long run.
While, yes, it's technically still a cost, for the long-term investor, the spread is usually just a drop in the bucket compared to other factors that have a far greater impact on overall returns. Things like capital gains taxes when you eventually sell, inflation eroding the purchasing power of your returns, and the overall performance of the asset over that extended period are much, much bigger considerations. So, while it's good for all traders to be aware of the spread, the long-term investor is probably the one who can afford to pay the least attention to its daily fluctuations.
Strategies for Minimizing the Spread's Impact: Trade Smarter, Not Harder
You can't make the bid-ask spread disappear entirely - it's a fundamental part of how markets work. However, there are definitely strategies you can use to minimize its impact on your trading results. These techniques are all about being smart with how you execute your orders and taking advantage of market conditions when they're most favorable. Here's how you can trade smarter, not necessarily harder.
Limit Orders: Getting the Price You Want (or Better)
Limit orders are a simple but effective way to stay in control of your trades. Instead of jumping in at whatever price the market offers, a limit order lets you set the exact price you're willing to buy or sell at. If you're buying, that means you can wait for the price to drop to your level. If you're selling, you can hold out for a better offer. The order only goes through if the market hits your price—or gives you something better.
This approach is especially useful when you’re trying to avoid overpaying or underselling, and it can help minimize the impact of the bid-ask spread. Market orders, by contrast, fill right away at the best available price, which often means paying the full spread. With a bit of patience, limit orders can offer better value. A buy order placed just below the current ask might catch a quick dip, while a sell order slightly above the bid might benefit from a short-term bump. It’s not about trying to time things perfectly—it’s about letting the price come to you instead of chasing it.
Trading During Peak Hours: More Liquidity, Tighter Spreads
The bid-ask spread tends to tighten when the market is buzzing with activity. More traders means more orders on both sides—buyers looking to get in, sellers ready to get out—and that extra liquidity helps smooth out pricing. With more competition among market makers during these busy periods, spreads often get pulled in closer as they work to win trades.
Of course, every market moves to its own beat. For U.S. stocks, some of the most active trading happens early in the day, especially during the first couple of hours after the open, when both North American and European traders are in play. In the world of crypto, things often get livelier during Asian market hours, where a large portion of global trading activity takes place. Knowing when a market tends to be most liquid can make a real difference—trading during those windows often means less slippage, tighter spreads, and smoother execution. There are plenty of tools out there that can help track market sessions or highlight overlaps if you want a clearer picture of when to act.
"Working" the Order: Patience and Precision
"Working" an order is a technique that involves patiently and strategically adjusting your limit price over time to increase the chances of getting filled without simply chasing the price. This approach demands careful observation of the order book and a good understanding of the buying and selling pressure building up at different price levels.
Using tools like Level 2 data, traders can observe how buy and sell orders are stacking up at different levels. For instance, if a large number of bids are clustering just below a current sell order, adjusting the limit price slightly downward might improve the chance of a fill without giving up much on potential profit. On the flip side, if there's a buildup of sell pressure well above a buy order, it may be smarter to hold the price steady or adjust slightly—depending on how strong the interest is and how fast the market is moving. The key with this approach is flexibility: being willing to react as the market changes, but without rushing to match every move.
Tools for Analyzing the Bid-Ask Spread: Data-Driven Decisions
Understanding what the bid-ask spread is matters—but knowing how to track and interpret it in real time is what turns knowledge into action. The spread isn’t just a number; it reflects what's happening in the market moment to moment, and the right tools can help make sense of those shifts. Whether you're spotting liquidity, gauging volatility, or looking for the best time to enter or exit a trade, a few reliable platforms can give you the data needed to make more confident, well-timed decisions.
Level 2 Data (Order Book Depth): Seeing Behind the Curtain
Most trading platforms show you the best available bid and ask—the highest price buyers are offering and the lowest price sellers are asking. But that’s just the tip of the iceberg. Level 2 data takes you deeper, showing the full lineup of buy and sell orders at different price levels, along with how many shares or units are sitting at each one. It’s essentially a behind-the-scenes view of the market’s order book.
This kind of detail can offer clues about where price might react. Large buy orders stacked at a certain level might point to an area of support, where buyers are ready to step in. On the flip side, a buildup of sell orders higher up could signal resistance, where sellers may start pushing back. By watching how these levels shift and how much interest is building at key prices, traders can get a better feel for momentum, hesitation, or potential turning points. For those who like to be precise with entries, exits, or stop placements, Level 2 data offers a layer of insight that basic price charts don’t always reveal.
Spread Indicators: Visualizing the Spread's Behavior
The bid-ask spread is one of those market details that can be easy to overlook, but it says a lot if you know how to read it. To make sense of how spreads shift over time, traders often turn to specific tools and indicators that track those changes and bring patterns to the surface.
One straightforward approach is to chart the spread itself—just plotting the difference between the bid and ask prices as it moves. Sudden jumps on that chart can point to rising volatility, a short-term liquidity crunch, or moments when buying and selling pressure falls out of balance. Even tools that aren’t built solely for spreads, like the Average True Range (ATR), can offer clues. A rising ATR during a period of widening spreads, for instance, might suggest the market’s getting jumpy, while a steady, low reading tends to align with calmer, more liquid conditions.
Advanced Concepts: Market Makers and Order Books Revisited
To really understand how the bid-ask spread works—and why it matters—it helps to take a closer look at what’s happening behind the scenes. Market makers and order books play a huge role in shaping how trades get matched and how prices move. They’re not just technical concepts; they’re the engine behind every transaction. Revisiting these ideas with a bit more context can bring clarity to how spreads form and why they behave the way they do in different market conditions.
The Role of Market Makers: Providing Liquidity and Taking Risk
Market makers are crucial participants in financial markets, acting as vital intermediaries to facilitate trading. Their primary function, as we've established, is to provide liquidity by continuously quoting bid and ask prices for various assets. Market makers effectively stand ready to buy and sell at any given time, ensuring that there are always potential counterparties available for other traders to execute their trades against.
By constantly providing those bid and ask prices, market makers significantly narrow the gap between buyers and sellers, fostering a much more efficient trading environment for everyone else. They make their profit from that tiny difference - the bid-ask spread. Resources like globalcryptoexpert.com often detail how these entities operate within specific markets. In essence, they are always available to both buy and sell a particular asset, taking on the inventory risk of holding assets that could change value. In return for taking on that risk and offering to execute orders instantly, market makers are compensated through that spread. This mechanism is what incentivizes them to provide that essential liquidity, making it significantly easier for other traders to enter and exit positions whenever they need to.
Understanding Order Books (Level 2): A Deeper Dive
If you want to see what’s going on beneath the surface of a market, the order book is where to look. Especially with Level 2 data, you get more than just the current bid and ask—you see the actual buy and sell orders stacked at different price levels. It’s like looking at the market’s waiting list: who’s trying to buy, who’s trying to sell, and how much they’re offering.
This kind of view can tell you a lot. When a bunch of buy orders are sitting around the same price, that area often acts as a kind of support—plenty of people are ready to jump in if the price drops. On the other hand, a wall of sell orders higher up can create resistance, making it harder for the price to push through.
But it’s not just about the numbers on the screen—it’s about how those numbers change. Watching orders come in, get pulled, or suddenly fill gives you a feel for which side—buyers or sellers—has more momentum in the moment. That shifting flow of orders can reveal more about market sentiment than price charts alone.
Conclusion: Master the Spread, Master Your Profits
The bid-ask spread might seem like a small detail, but it plays a big role in how trades play out—especially in fast-moving or short-term strategies. Understanding how it works, what influences it, and how to manage it can help avoid unnecessary costs and improve the way trades are executed. Whether it’s learning how to read the order book, using limit orders more effectively, or paying attention to market activity, being aware of the spread gives traders a real edge. In the end, it’s not just about getting in and out of trades—it’s about doing it smarter.